————————————————————————————————————————————————
Putting It All Together
————————————————————————————————————————————————
————————————————————————————————————————————————
As I said earlier, I do not want to ignore numbers which do not have a statistically significant correlation with winning, because clearly they can still matter for quarterback play. Neither do I want to overvalue them in relation to the numbers which do have a statistically significant correlation with winning. Fortunately, it turns out that the statistics that aren't statistically significant have a small correlation anyway, so nothing needs to be done with them.
Now, what follows will be multiplying these by the proper amount to allow us to add all the various QB statistics we've considered. Why? Because we don't want Completed Air Yards unjustifiably dominating the formula simply because yards tend to have more digits than touchdowns, for example. The units of these final coefficients will be the exact units necessary to make the total formula unitless.
What follows is that procedure.
————————————————————————————————————————————————
The Coefficients of Determination for each relevant statistic are:
————————————————————————————————————————————————
PASSING STATS:
CAY: 0.3226
TD: 0.5456
INT: 0.04399
RUSHING STATS:
RYD: 0 (x < 30), 0.08664 (x >= 30)
RTD: 0.001848
CLUTCH SITUATIONS:
4QC/L%: 0.3011
BOW/W%: 0.3026
1DS%: 0.7404
SACK STATS:
S: 0.2127
SYL: 0.2783
FUMBLE STATS:
F: 0.05265
————————————————————————————————————————————————
Adjusting these Win% Coefficients of Determination so that all QB statistics considered can be combined:
————————————————————————————————————————————————
As mentioned above, we have to modify the final coefficients so that each one is approximately of the same order. Otherwise, three digit stats will overwhelm two digit stats, and undermine all the work we've done. In the case of CAY, for example, the relationship between CAY and CAY/A is almost always below ten, no matter how large the CAY. For example, Josh Allen's season CAY is 2664, but his attempts are 646. 2664/646 = 4.124. His week 5 CAY was 203, and his attempts were 26. Thus, his CAY/A was 7.81, which is below ten. Then, if we look at one of the worst at this statistic, Zach Wilson, for the season his CAY and CAY/A were 1245 and 3.25. And his week 5 numbers were 113 CAY and 3.5, which is also below ten. There could conceivably a time in which a player averages 10 or more CAY/A, but it will be rare.
What this tells us is that we'll want to multiply CAY by about 0.1.
The goal of the Adjustment Coefficient here is to find the numbers that if took each raw statistical input divided by the attempts and multiplied that quantity by these respective numbers, we'd get a number of the same order of magnitude for every stat—but between 0 and 1. We then multiply that by the Coefficient of Determination to get the final coefficients.
PASSING STATS:
Mean attempts: 504
CAY: Mean CAY: 1926.581. Mean CAY/A: 3.823. ADJUSTMENT COEFFICIENT: 0.1
TD: Mean TD: 23.387. Mean TD/A: 0.0464. ADJUSTMENT COEFFICIENT: 10
INT: Mean INT: 11.226. Mean INT/A: 0.0223. ADJUSTMENT COEFFICIENT: 10
RUSHING STATS:
Mean rush attempts: 53
RYD: Mean Rush Yards: 236.710. Mean RYD/A: 4.466. ADJUSTMENT COEFFICIENT: 0.1*
RTD: Mean Rush TD: 2.387 Mean RTD/A: 0.045. ADJUSTMENT COEFFICIENT: 10
CLUTCH SITUATIONS:
Mean 4QC: 1.774. Mean Losses: 7.0484.
Mean 4QC/L = 0.2517. ADJUSTMENT COEFFICIENT: 1
Mean BOW: 2.323. Mean Wins: 7.855
Mean BOW/W = 0.2960. ADJUSTMENT COEFFICIENT: 1**
Mean pass attemps: 504
1DS%: Mean First Down Pases: 176.161 Mean 1D%: 0.3495. ADJUSTMENT COEFFICIENT: 1
SACK STATS:
Mean pass attempts: 504
S: Mean Sacks: 32.0968. Mean Sack/A: 0.06368. ADJUSTMENT COEFFICIENT: 10***
SYL: Mean Sack Yards Lost: 228.516. Mean SYL/A: 0.4534. ADJUSTMENT COEFFICIENT: 1***
FUMBLE STATS:
Mean pass att + rush att + sack: 589.548
F: 7.806 Mean F/A: 0.0132. FUMBLE ADJUSTMENT COEFFICIENT: 10
*Due to rush yards varying based on production, and being so small even for those who utilize their legs frequently, the rush yardage coefficient will be multiplied by 1.5 for those who utilize rushing frequently.
**As mentioned earlier, the blowout win coefficient will be multiplied by 0.25, to represent quarterbacks not being solely responsible for them.
***As mentioned earlier, sacks and sack yards lost cannot be solely the fault of quarterbacks. Sacks generally come because either the line fails, the WRs fail to get open, someone runs the wrong play, or the QB holds the ball to long. So, compromising, I will make quarterbacks responsible for one fourth of every sack. Which means the sack coefficients will be multiplied by 0.25.
.
————————————————————————————————————————————————
Multiplying the Weighted Win% Coefficients of Determination by the above Adjustment Coefficients:
————————————————————————————————————————————————
PASSING STATS:
CAY: 0.3226*0.1 = 0.00326
TD: 0.5456*10 = 5.456
INT: 0.04399*10 = 0.4399
RUSHING STATS:
RYD: 0, 0.08664*.01 = 0.008664
RTD: 0.001848*10 = 0.01848
CLUTCH SITUATIONS:
4QC/L%: 0.3011*1 = 0.3011
BOW/W%: 0.3026*1*0.25 = 0.0756
1DS%: 0.7404*1 = 0.7404
SACK STATS:
S: 0.2127*10 = 2.127*0.25 = 0.5318
SYL: 0.2783*1 = 0.2783*0.25 = 0.0696
FUMBLE STATS:
F: 0.05265*10 = 0.5265
.
.
————————————————————————————————————————————————
Final Coefficients
————————————————————————————————————————————————
All the above values will be rounded to the nearest single significant digit, except rushing yards, which are tiny and will thus be rounded to the nearest second significant digit.
So here are the FINAL Coefficients:
PASSING STATS
CAY: 0.003
TD: 5
INT: 0.4
RUSHING STATS:
RYD: 0.001, 0.013*
RTD: 0.02
CLUTCH SITUATIONS:
4QC/L: 0.3
BOW/L: 0.08*
1DS%: 0.7
SACK STATS:
S: 0.5*
SYL: 0.07*
FUMBLE STATS:
F: 0.5
*Again, each of these will be slightly modified based on the QB's relative contribution to them, and in the case of rushing, based on the wide variance in correlation with winning based upon how frequently each QB runs.
.
.
.
————————————————————————————————————————————————
————————————————————————————————————————————————
Final WIN% QUARTERBACK RATING Formula
———————————————————————————————————————————————
————————————————————————————————————————————————
Well, here it is...

where,
ATT P = Passing attempt
ATT R = Rushing attempt
CAY = Completed Air Yards
TD = Passing Touchdowns
INT = Interceptions Thrown
RYD = Rushing Yards
RTD = Rushing Touchdowns
4QC = 4th Quarter Comeback
L = Losses
BOW = Blowout Win
W = Wins
S = Sacks
SYL = Sack Yards Lost
FUM = Total Fumbles
The red font indicates the combination of the weighted and the adjustment coefficient which gives each stat the proper importance it should have with respect to winning percentage. The addition of 30 and multiplication by 120 of the final product was chosen to get the numbers a little closer in line with NFL passer rating—in particular, the highest rating in NFL passer rating for 2021 was about 112, and that is the same for the so-named WQBR.
Now, this is obviously a lot, but these are all the categories in this analysis that were considered important. And the coefficients for this formula are all tied to the real world correlation with win percentage each of these statistics has, along with a simple weighting value to keep raw digits of stats measured in one unit from overwhelming stats measured in another unit. A couple of other tweaks related to the significance of the data and common sense were made, but for the most part, the overwhelming factor in this rating is how each stat correlates with winning, based on the 2021 statistics of the quarterbacks who played at least 10 games.
Each of those weighting values, mind you, are the exact units to make this formula entirely unitless (e.g., in the first fraction, the 0.003 coefficient is in units of [Pass Attempts]/[Yards], while the 5 coefficient is in units[Pass Attempts]/[TD], and so on, which puts every unit in the numerator in units of [Pass Attemps], resulting in a unitless number. Similarly, the other fractions will end up unitless, resulting in the final number also being unitless).
This formula obviously does not take into account competition. I do not believe such rankings are reliable enough to use here. For example, a team in the AFC West might have a bad passing defense, but that division is full of great QBs. It would make sense for their passing defense to put out statistics that undervalue those teams' respective pass defense. There are probably ways to weight such team rankings, but I'll leave that for someone else.
————————————————————————————————————————————————
Giving the WIN% QUARTERBACK RATING a whirl
————————————————————————————————————————————————
Here it is... a few surprises, but other things fit exactly what I expected:
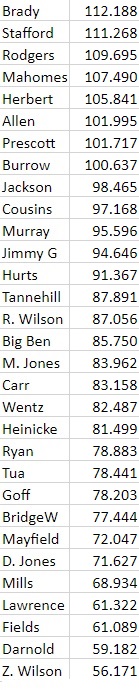
Look where Jimmy G is: he's 12th. That's higher than most people would rank him—higher than ESPN's Total QBR. And it's the highest that I thought he could reasonably be (I usually argue on the forums he's somewhere between 12 and 18). Stafford is pretty high, too. So why are they ranked so high? Well, for starters, when it comes to the three clutch/"intangible" ratings, Jimmy was near tops in the NFL, and Stafford near the top as well. Shocker, I know, but remember who the two QBs in the NFC Championship were. It's very interesting, because in a lot of ways, Stafford and Jimmy play a similar game, except Stafford simply has an elite arm and Jimmy doesn't.
Anyway, from what I can tell, for both of them, three things really conspired to rank them higher than is usually done:
(1) The two are both near the top of the NFL in first down passes converting to first downs (Stafford is third, Jimmy is fourth) (2) It turns out that interceptions do not have a strong correlation with losing, and as each stat in my Win% Quarterback Rating is weighted against win percentage, two guys who throw a lot of picks are not penalized excessively for them. Touchdowns correlate almost three times as much with win percentage, and the coefficient of determination is twelve times as large—which was absolutely not something I expected.
The true test, of course, is Kirk Cousins, who is 4th in NFL passer rating, but is 15th in Total QBR per ESPN. Fortunately for my latest attempt at a custom passer rating, Cousins ranks 10th here, which is worlds better than 1st or 2nd—which is what I was getting when I initially attempted to do this in the Jimmy thread. And regarding Cousins, I'm skeptical of ESPN's Total QBR because they have him at 15th, but Carson Wentz at 9th. I've got Wentz down to 19th. I feel in that case, my rating is more accurate. But most importantly, since no one outside of ESPN knows how Total QBR really works, who can say much about it? My rating was heavily influenced by win percentage. If I understand it correctly, ESPN's relies heavily on "expected points," but I wonder if that is a better way. First, it's on a play by play basis, and scoring is usually about a series of plays working in concert; and second, WINNING isn't necessarily about scoring as many points as possible. You have to give your defense a chance to rest, and sometimes you need to run out the clock.
I may alter which stats I include later, and maybe I should remove the "common sense" modifications I made for sacks, rush stats, and blowout stats.
But I feel like this is a pretty good start.
.
.
Sources for statistics calculation:
https://www.socscistatistics.com/tests/pearson/default2.aspx
https://www.socscistatistics.com/tests/spearman/default2.aspx
https://www.statskingdom.com/linear-regression-calculator.html
https://www.calculatorsoup.com/calculators/statistics/mean-median-mode.php
and I used Excel for everything else, including standard deviation and normalization.
(EDIT—Post so long I needed two...)
[ Edited by 5_Golden_Rings on Sep 16, 2022 at 3:19 AM ]


